|
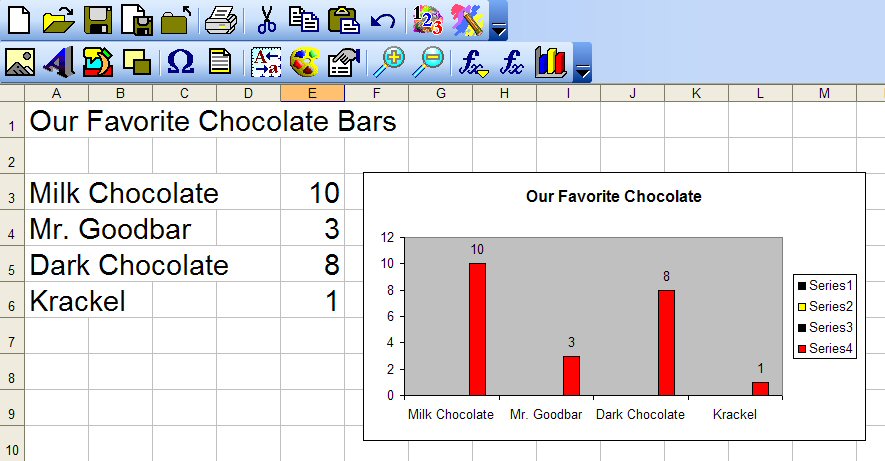
Our second
grade class started our Chocolate study by graphing our favorite
chocolates. After eating the chocolate, each student glued the
wrapper on chart paper to create a graph. We then used Max Count
to create a graph. This is a new program to us and right now we
only have the trial version. We were unable to get it to look
the way we want but the data is correct.
I read two
books to the class, The Chocolate Touch and Chocolate
Fever. After reading the stories, the students were asked to
compare the stories. We created hand drawn Venn diagrams and
then struggled to create one using Kidspiration.
We also
used the internet to view videos on how chocolate is made. We
used this information to create a flow chart using Kidspiration.
Click
HERE to download the
Kidspiration 2.0 file
The
students enjoyed the activities. We learned about the computer
programs together. We made mistakes, got frustrated, lost data
and much more interesting learning situations. Through this we
are a more technological savvy classroom with much more to
learn. |