|
Our second grade class
has been reading stories and poetry about fall as we also enjoy
the cooler temperatures of autumn in Texas. Students have
written circular and acrostic poetry using Microsoft Word. These
are posted under “Student Work” on our
web page. We also wrote a class acrostic poem “Fall
is Here! We love It! Some of our favorite poetry books
include: Autumn: An Alphabet Acrostic by Steven Schnur,
Pieces: A year In Poem & Quilts by Anna Hines, and
Autumnblings by Douglas Florian.
Our reading story
this week was Lemonade For Sale by Stuart J. Murphy, and
the children in the story made a bar graph to monitor the amount
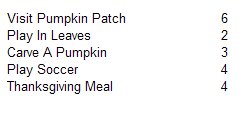
of lemonade that they sold. So the childen were assigned a
graphing homework activity. The assignment was to choose 5 fun
fall activities and survey 10 people to find out what their
choice was for their favorite fall activity. In the computer lab
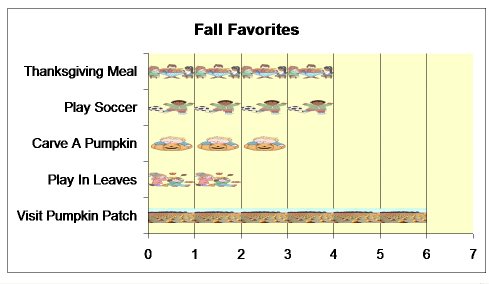
we used Microsoft Excel to make bar graphs of the results
similar to those depicted in our story. Then we changed the bar
graphs to picture graphs. Please see the sample graph and directions for
making a pictograph in Excel below. We also used
Kidspiration to create a graphic organizer to depict things
that we like to do in the fall.
Click
HERE to download Kidspiration file.
Using Excel To Make a Pictograph
1. Enter data and
highlight to make a chart. Click on the Chart Wizard tool
at the top of the screen.
2. Select a column or bar graph, clicking Next as prompted,
typing in a Chart Title, and labeling the x and y axes.
3. Click O.K. to save the graph as an object in Excel.
4. Click once on the bars to select all of the bars. Then click
again on the edge of one of the bars to select just one.
5. From the Draw menu (View/Toolbars/Drawing) and insert a
picture or clip art.
6. Your picture may be stretched, but don’t panic.
7. To fix this, right click on the picture bar, which is now
your stretched picture.
8. Select Format Data Point.
9. In the Format Data Point window, click on Fill Effects.
10. Under Format, select Stack and Scale to: 1
units/picture
11. Click and drag on a corner to resize the chart.
12. Click on another bar and follow the same steps, selecting a
different picture.
Language Arts TEKS
(2.14) Writing/purposes. The student writes for a variety of
audiences and purposes, and in various forms.
Math TEKS (2.6) Patterns, relationships, and algebraic thinking.
The student uses patterns to describe relationships and make
predictions
|

©
Patricia Knox & Susan Silverman - Fall Into Autumn 2004
|