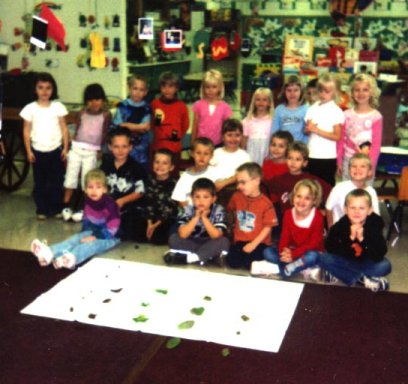
Students brought fall items in from home
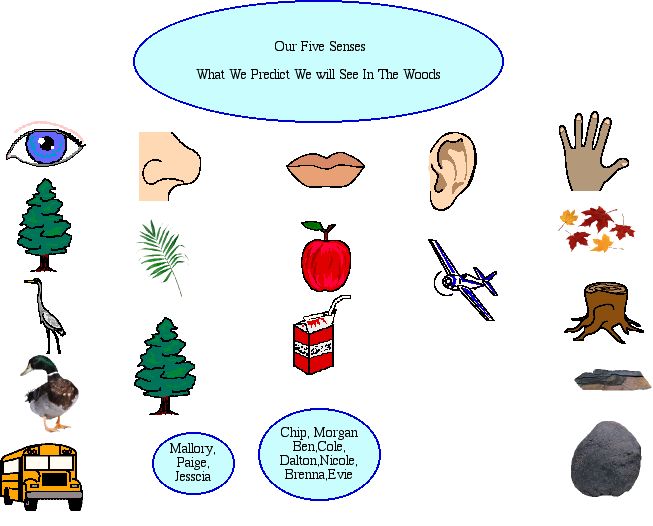
and we graphed them. Half of the class then predicted items we
would look for in our walk to the Benn Nature Conservancy using
our five senses. Using Kidspiration we turned their predictions
into a graph. During the field trip each child also filled in
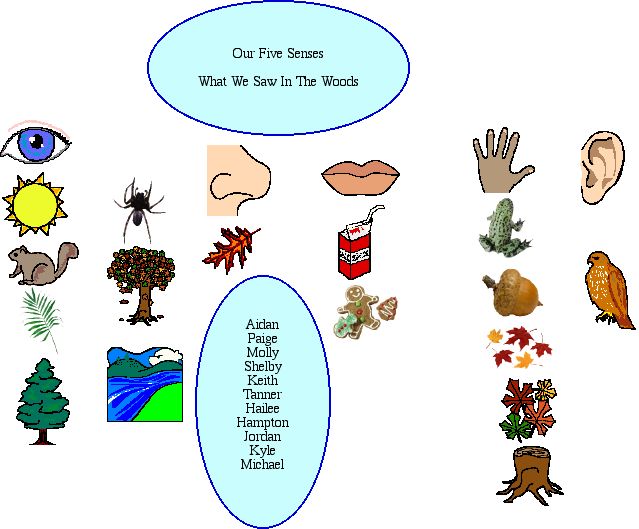
their own 5 senses chart in the woods. After our fieldtrip, we
brainstormed with the other half of the class on what was
actually seen/heard/tasted/felt/smelled at the Benn. Another
Five Senses Kidspiration graph shows what we actually
experienced at the Benn.
Wisconsin State Standards Used in This
Project
Use the science content being learned to
ask questions, plan investigations, make observations, make
predictions, and offer explanations.
Use data they have collected to develop
explanations and answer questions generated by investigations.
Communicate the results of their
investigations in ways their audiences will understand by using
charts, graphs, drawings, written descriptions, and various
other means, to display their answers.
Communicate mathematical ideas in a
variety of ways, including words, numbers, symbols, pictures,
charts, graphs, tables, diagrams, and models.
Connect mathematical learning with other
subjects, personal experiences, current events, and personal
interests.
Use a computer and productivity software
to organize and create information.
Use media and technology to create and
present information.