|
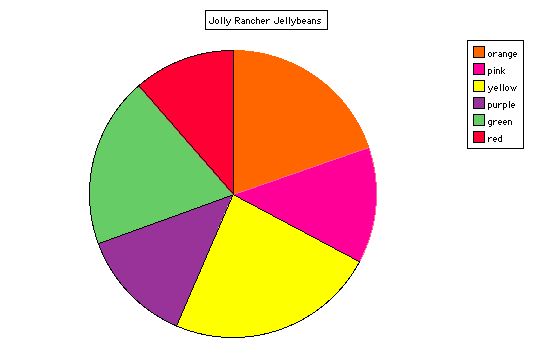
For several weeks our class has been exploring graphs. We have made picture graphs with fruit loops, line graphs about birthdays, circle graphs with coin tosses, and bar graphs with skittles and jellybean data! We also, after presenting reports, graphed our favorite Winter Olympic sports. You can see why we were so excited when we heard about the Graph Goodies project! For this project, we used some of our data from our Jellybeans 2002 project. We had four teams, each with a bag of jellybeans. We opened the bags, sorted by colors, and then decided how a bar graph could represent our data. Next we used a spreadsheet in Appleworks 6 to create circle or pie graphs. Below is the guiding question for our data collection and the graph from one of our Jellybean Teams (Team 4). What color jellybean do you find most often in packages of jellybeans? For this graph we used one bag of...
After answering the
questions, reward yourself with these: |